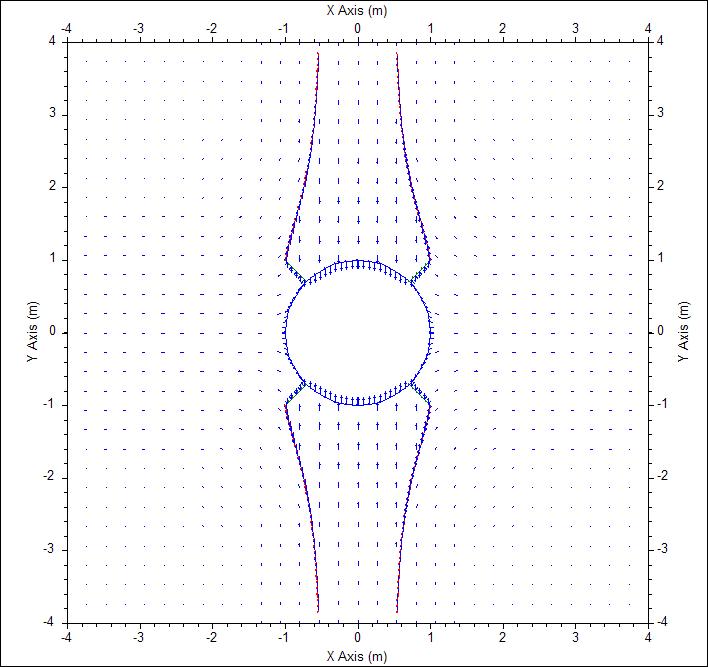
Check this menu item to view the displacement vector at specified grid points in the model. Rock displacement at a grid point will be plotted on the screen as a vector with an arrow indicating the direction of the displacement, and the length of the vector is proportional to the values of displacement.
The value of maximum displacement in the plot is given on the top of the plot window (in metres).
You can customize the display attributes via View | Plot Setup.
Example of Displacement display:
